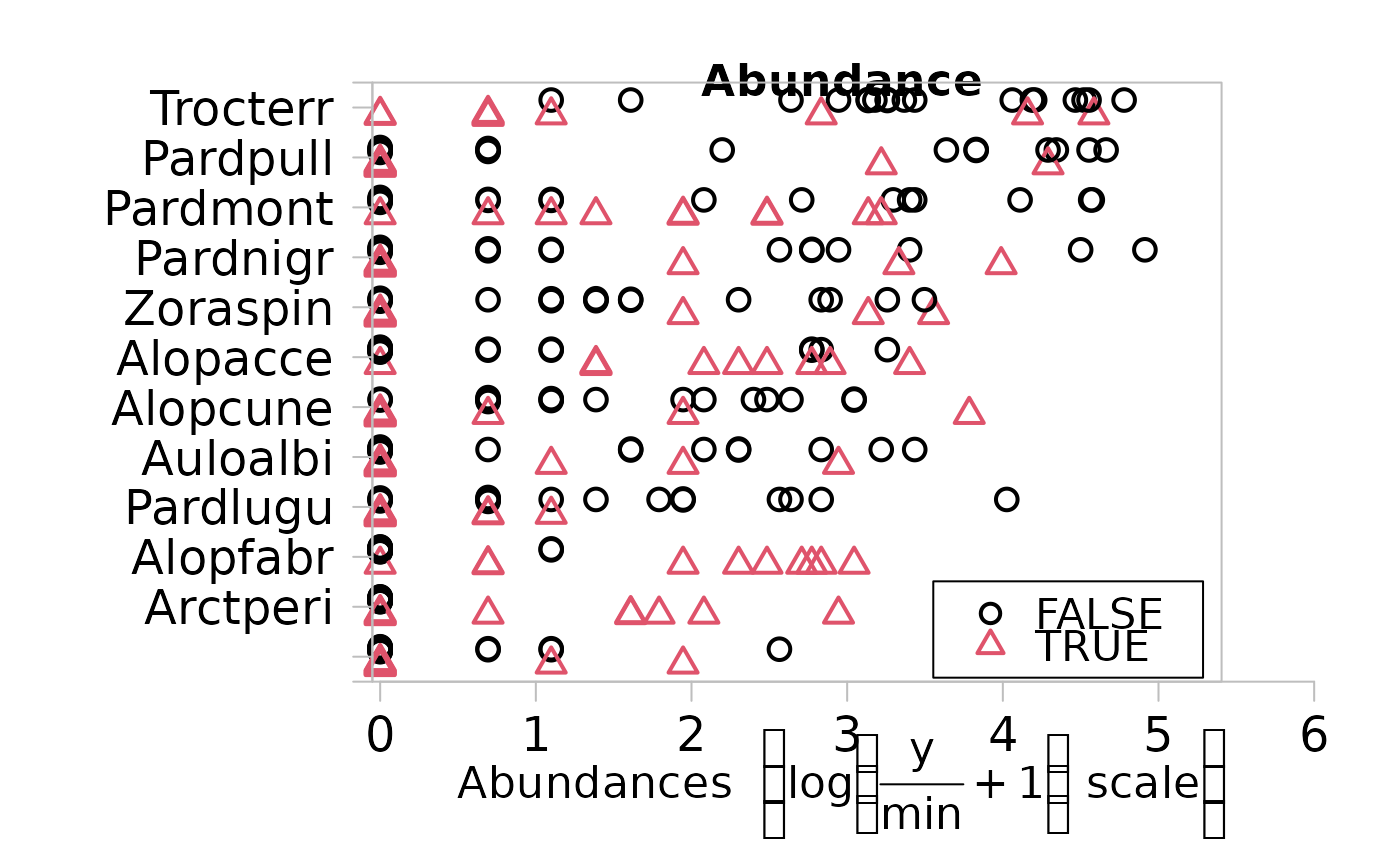
Draw a Mvabund Object split into groups.
plotMvaFactor.RdDraw the mvabund object x but split the data into
groups according to the grouping variable y.
Arguments
- x
a
mvabund object, a matrix with multivariate abundance data.- y
a factor or a data.frame with factors, non-factor columns in a data.frame are ignored.
- type
what type of plot should be drawn, allowed types are "p" for scatterplot, "bx" for boxplot and "n" for no plot. Other types, as used in
parare NOT allowed.- main
the title of the plot, see
plot.- n.vars
the number of variables to include in the plot.
- transformation
an optional transformation, "no" = untransformed, "sqrt"=square root transformed, "log" (default)=log(Y/min+1) transformed, "sqrt4" =4th root transformed.
- legend
logical, whether a legend should be added to the plot.
- ...
arguments to be passed to or from other methods.
Details
For each variable in y that is a factor, a plot is drawn. When boxplots are drawn
the colors, that can be supplied by col are used to display different
factor levels.
For scatterplots it is also possible to use the plotting symbols, specified by
pch for that.
If the colors and for scatterplots the plotting symbols are not supplied, they will be automatically generated. However, the plotting symbols will only be automatically used in this way if there are up to seven different levels.
If colors or the plotting symbols are supplied, but the number of factor levels is bigger than the the number of different values, they will be replicated.
Sometimes the legends might be only partially visible, especially when the width
of the graphics device is too small. To fix this, create a graphics device with
a larger width (see help("device") for on available devices and their details)
and then repeat the
plotMvaFactor command.
References
Warton, D. I. ( ) Raw data graphing: an informative but under-utilised tool for the analysis of multivariate abundances, , .